


 Oct 23, 2024
 3 min read


No one can argue that steel isn’t strong and reliable. It’s a top-notch material for creating a long-lasting, durable product. But when your product is made from such a strong material, you’ll need even stronger tools to manufacture the product itself, not to mention a strong understanding of your data and the insights it can provide about when machines will need to be repaired or replaced.
Let's consider a forging company—let's call it Silver Dam International—where Bill, a process engineer, is studying the performance of a forging die and fixture to:
- increase the quality of the crankshaft he forges; and
- reduce costs for your customers
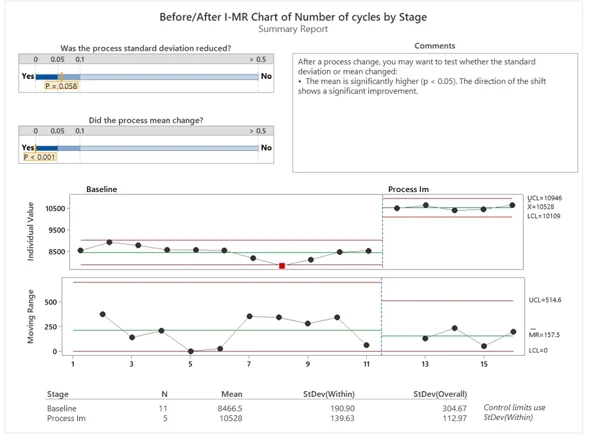
Determining the Baseline with a Control Chart
To begin, Bill asks his team to plot the average number of cycles on a control chart in the Minitab to determine a baseline:
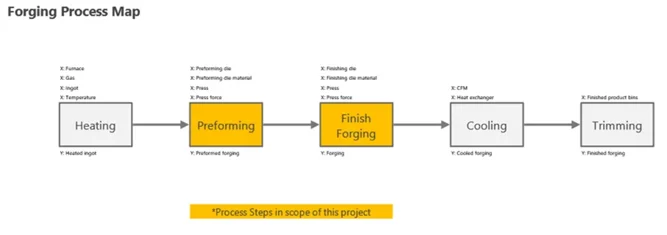
Process mapping
Once the baseline is established, they can create a map of the process node Minitab Workspace to identify the main steps, inputs and outputs of the process that reveal opportunities for improvement.
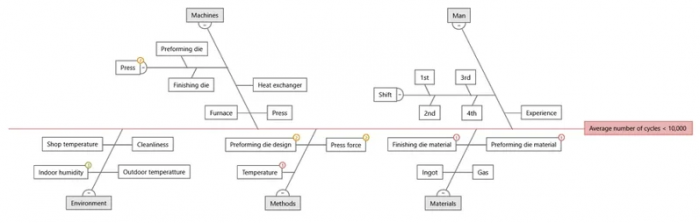
Cause and Effect Brainstorming
The team can then make a simple Cause and Effect Diagram (also known as Fishbone) to brainstorm possible causes of error:
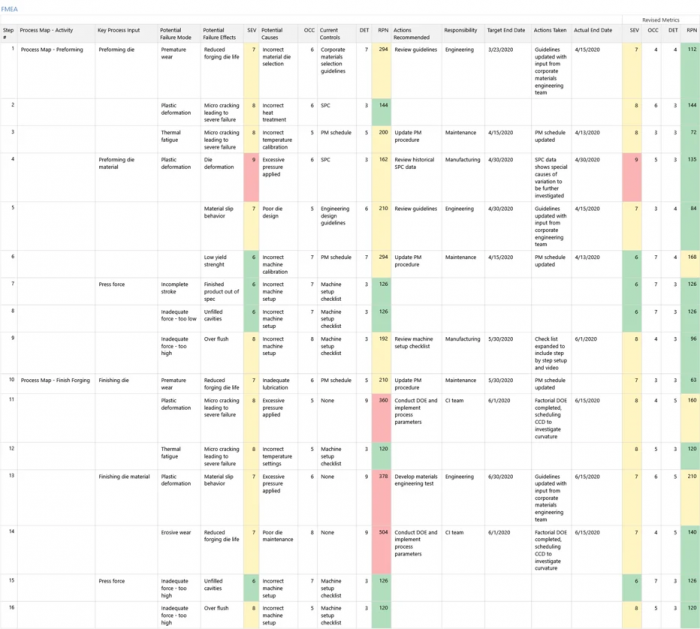
Finally, an FMEA and control plan to help chart the path to improvements.
Bill and the team complete an effects and failure modes analysis (FMEA) in the Workspace to assess risk and identify mitigation opportunities. They have already documented specification limits, inspection frequency, and contingency plans in a Control Plan to ensure process improvements last.
Viewing everything
The forging die is the tool that needs to be strong enough to force the metal into its shape without deforming or breaking, but you need different types of tools and strength when doing a comprehensive assessment of a process with so many variables: your data analysis and design software.
Bill and the Silver Dam International team used a variety of problem-solving tools to comprehensively visualize the critical factors affecting the forging process. The team uncovers baseline metrics and process improvement opportunities with the data collected and analyzed in the Minitab, which can be easily right-clicked and imported into the Minitab Workspace. From there, they visualize the process on a process map, brainstorm cause and effect with a fishbone diagram, and come up with a general plan for how to eliminate waste and address the most critical process inputs with their FMEA and Control Plan documents.
It's helpful to work with a set of tools that complement each other and have a common goal of helping you achieve your vision of success!
Talk to Software.com.br and get to know better Minitab together with a specialist.