Kylebank Software

Filters

Sort by:
Categories
Categories
More
Business area
Sector of activity
More
Manufacturer

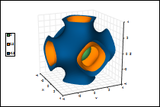
TeraPlot scientific plotting software provides everything you need for publication-quality graphing in science and engineering. At its core is the ability to create 2D and 3D graphs based on tabular data and/or mathematical expressions. Single plot types can be used individually in a graph, or multiple plots can be combined to build graphs ranging from basic line plots, through 3D scatter plots, to complex 3D visualizations comprising analytical expressions, tabular data, 3D objects, annotation, and image overlay. In addition to these primary capabilities, a variety of features such as flexible data import and the ability to create graphs with just a few mouse clicks through graph wizards make TeraPlot a highly effective scientific visualization tool. The program also provides curve fitting and data analysis capabilities.

en_US

Filters

Categories
Categories